The acquisition and processing of reflection seismic data usually result in a seismic image of acoustic impedance interfaces. If these interfaces are assumed to follow lithologic boundaries, then the seismic image is actually an image of subsurface geological units and the structures they form. The goal of seismic interpretation is to recognize plausible geological patterns in the seismic image. Seismic interpreters must rely most on their knowledge of structural geology; expert knowledge of seismic wave propagation physics or signal processing theory is less important. In this respect, seismic exploration is somewhat like medical imaging; the physician reading a patient's X-ray or MRI relies most on his or her expertise in human physiology, not expertise in MRI physics.
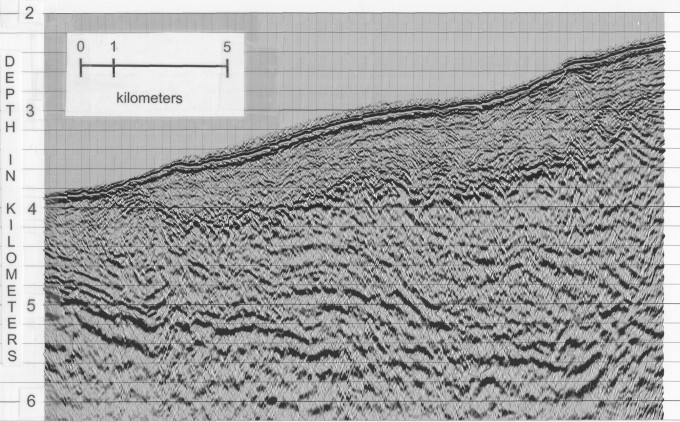
Figure 5: The center section of a 3-D poststack depth migrated seismic image of the offshore Costa Rica accretionary prism. (Click for larger figure.)
Figure 5 shows a seismic image section through the accretionary continental margin offshore Costa Rica's west coast. The section is taken from a 3-D poststack depth migrated image volume. The survey area was chosen for scientific purposes, not for hydrocarbon exploration; the section is presented here to provide an example of a seismic image and of seismic interpretation.
The Costa Rica shoreline is approximately 40 km northeast, or right, of the right edge of Figure 5. The seafloor is easily identified in this section, dipping to the southwest from 2.3 km depth on the right to 4 km depth on the left. At this location, the Cocos tectonic plate which underlies this part of the Pacific Ocean is being subducted beneath the Carribean tectonic plate on which Costa Rica sits. The top of the igneous rocks which make up the Cocos tectonic plate are visible on the left side of the section as a series of thick reflectors at approximately 5 km depth. These reflectors are broken and discontinuous, but they can be interpreted as dipping northeastward to a depth of almost 6 km on the right, providing visual evidence of the subduction of the Cocos plate. Immediately above the Cocos surface is a wedge-shaped jumble of sediments that thickens from 1 km in the southwest to 2-2.5 km in the northeast. The reflectors in this package predominantly dip to the northeast and are highly discontinuous. These reflections are from sediments that were deformed and "scraped off" the Cocos plate during subduction; this package of sediments is known as an accretionary wedge. Immediately above the accretionary wedge and below the seafloor are sediments that have been deposited from the northeast by normal marine processes. This sedimentary unit is more than a kilometer thick on the right side of the section, but "pinches out" before reaching the section's left side. (A pinch out is the gradual termination of a sedimentary unit.)
After inspection and preliminary interpretation, the next step in interpreting seismic images is reflector picking. In seismic interpretation, picking involves identifying and recording the position of specific reflection events in the seismic image. In modern practice, the seismic image is usually displayed using a computer, and the interpreter picks the data and records his or her picks using computer software. The interpreter usually selects a limited number of reflectors for picking, then attempts to pick those reflectors everywhere they are present throughout the seismic image or image volume. Reflectors may be selected for picking either based on their geological significance or because they have a unique character that can be recognized throughout the seismic image. In the case of the Costa Rica example, an interpreter might opt to select the seafloor reflection, and the top and bottom of the accretionary wedge sediments for picking. Observing Figure 5, it becomes evident that picking reflection boundaries may require a significant amount of geological inference and imagination when reflectors are highly disjointed. Sedimentary reflections in marine seismic data are frequently more continuous than in this example. However, the data quality of Figure 5 is typical of much seismic data. Due to weathering of the near surface, land data frequently suffer statics problems that may not be fully corrected during processing. Land seismic data from difficult acquisition regions such as mountainous areas may contain much more noise and much less reflector coherency than this example. When faced with discontinuous reflections, the interpreter must discriminate whether the discontinuity is due to adverse acquisition conditions, is evidence of a fault or a geological unconformity, or is a processing artifact. In good data areas, reflection events may terminate sharply at fault planes. If the reflectors are sufficiently distinctive, the interpreter may be able to measure the apparent throw or displacement across faults.
Reflection picking is preformed concurrently with the identification of local geological structures. The identification of structures in seismic images is critically important to oil and gas exploration activities. Because hydrocarbons are less dense than water, they migrate toward structural highs in porous, permeable rock layers. In the energy industry, seismic identification of an enclosed structural high is a standard indication of a possible accumulation of hydrocarbons. In addition to faulting, complicated geological structures may result from tilting, folding and plastic flowing of rocks. Some of the geological structures that result from this behavior include tilted beds truncated by faults, tilted beds truncated by unconformities, and anticlines. Even areas subjected to only minor regional tectonic stress may be deformed in highly complicated manners. Salt diapirism is an extreme example of this phenomenon and has utmost importance in the energy industry because of the structural highs it creates in surrounding clastic sediments. Salt diapirs are frequently easy to recognize in seismic images because of their distinctive three-dimensional geometries and the strong acoustic impedance contrast typical of the top of salt interface. However, these distinctive characteristics make salt imaging one of the most difficult problems in exploration seismology. The need to properly image the subsurface around these bodies was a primary motivation in the energy industry's adoption of 3-D seismic acquisition. More recently the goal of imaging sediments under salt bodies has been the primary driver in the development of prestack depth migration processing. Even when good seismic imaging is achieved, the turbulent structural history of salt features can make interpretation a challenging exercise.
Picking is usually performed on vertical seismic sections, and can form the basis for an interpreted geological section. However, an idealized geological section is rarely the final product of seismic interpretation. To arrive at a complete understanding of subsurface structures and their geology, and to identify possible hydrocarbon traps, it is usually necessary to produce maps and three-dimensional models of the subsurface. This necessitates the interpretation and picking of multiple seismic sections in a survey area. The availability of a 3-D image volume facilitates better interpretations, even for inherently two-dimensional structures. Figure 6 is a display of a 3-D seismic image volume of the Barbabos accretionary wedge. The vertical axis of the volume extends from 4.0 km to 6.5 km. A vertical exaggeration of approximately 2.5 times has been applied. The use of volume visualization software allows the display of the entire migrated volume. A transparency function has been applied to the image so that only the two most strongly reflecting surfaces are visible: the sea floor and the top of the subducting oceanic plate. The three-dimensional display provides a wealth of additional structural detail that is not available when the seismic image is interpreted using only 2-D vertical seismic sections.
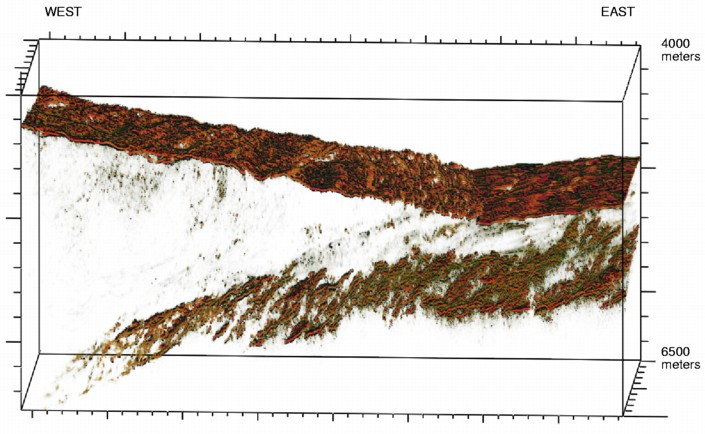
Figure 6: Display of a 3-D seismic image volume from the Barbados accretionary wedge using voxel representations with transparency to show major structural features. (Click for larger figure.)
Until this point, this discussion of seismic interpretation has been limited to the interpretation of geological structures in the seismic data. Although a suitable geological structure that can act as a trap is a necessary condition for hydrocarbons in the subsurface, it is not a sufficient condition. For subsurface hydrocarbons to exist, reservoir rocks must be present in the subsurface, and the geological history of the region must have been suitable for hydrocarbon formation and pooling. The practice of seismic interpretation to infer depositional history, tectonic history and lithology is known as seismic stratigraphy. In some geological settings, seismic data are routinely used for direct detection of hydrocarbons. The success of direct detection methods is primarily due to the anomalous seismic response of porous rocks which contain natural gas. The earliest use of direct detection methods was the identification on stacked sections of large negative amplitudes or bright spots. This method is not foolproof, as the presence of gas does not always produce bright spots, and bright spots can result from a number of geological conditions other than the presence of gas. A more robust methodology involves analysis of prestack seismic data to identify characteristic variations in reservoir reflectivity as a function of seismic source-receiver separation. Interpretation of amplitude variation with offset, or AVO, has enjoyed considerable success at distinguishing brine-filled reservoirs from gas-filled reservoirs. However, AVO analysis is not infallible. Most notably, the inclusion of small amounts of carbon dioxide in brine-filled rocks can sometimes produce AVO results identical to those of a reservoir full of natural gas. In addition to direct detection of natural gas, AVO has been used for a number of other problems involving lithologic discrimination. For example, AVO has been used to infer fracture orientation in carbonates from the variation in AVO response with source-receiver azimuthal orientation.
A couple of recent technological advances may increase the role of seismic interpretation in hydrocarbon exploration and recovery. One is the application of time-lapse seismology, also called 4-D seismology. In time-lapse seismology, a producing field is periodically resurveyed so that the new seismic image volume can be compared to past image volumes for evidence of lithologic changes that occurred in the time between surveys. Time-lapse methods are being used on a limited basis as a tool for reservoir production monitoring. Production engineers try to manage producing reservoirs by strategic positioning of production wells and injection wells, which are used to inject water or gas into a reservoir with the intent of pushing hydrocarbons toward production wells. Production engineers normally only have information about fluid flow within the reservoirs at the well locations. The seismic method provides a much more detailed picture of lateral variations in the earth; when 4-D reflection seismology provides a direct indication of fluid and gas movement, reservoir management and hydrocarbon recovery rates are greatly improved. Multi-component seismology may be a complementary advance to 4-D seismology. By interpretation of multi-component seismic data, it may be possible to recover additional information about subsurface lithology because the mode converted reflection contains new information not available in the P-wave reflection. For example, the converted wave reflection amplitude is more directly sensitive to rock density than the P-wave reflection, and rock density may be an indicator of pore fluid type. Thus far, however, industry applications of multi-component seismology have been for structural imaging beneath gas-invaded zones, which severely attenuate P-wave reflections, but not S-wave reflections.
